")


Simple Gantt chart is most basic and simple version of Gantt chart excel. This is simply project management important tool which is used to identify project overall performance, monitor, allowing stakeholders to change data of different projects and budget with other allowances according to the performance of employees.it is a horizontal bar chart in which starting date and end date, project duration can be shown of every task. we can say it is basically a roadmap for any project which is easily visualization of project timeline. Tracking Gantt Charts are used in Tracking Multiple Projects in excel
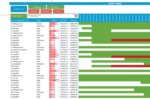
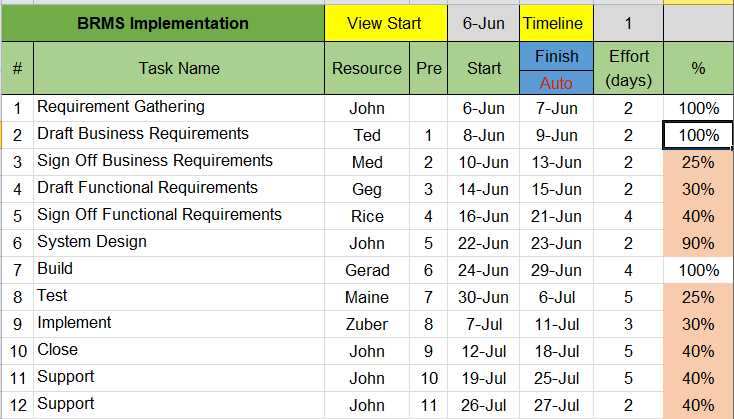
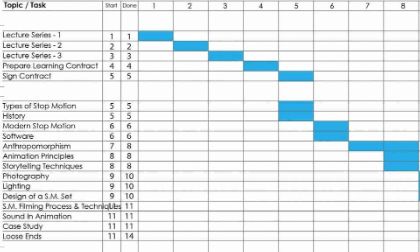
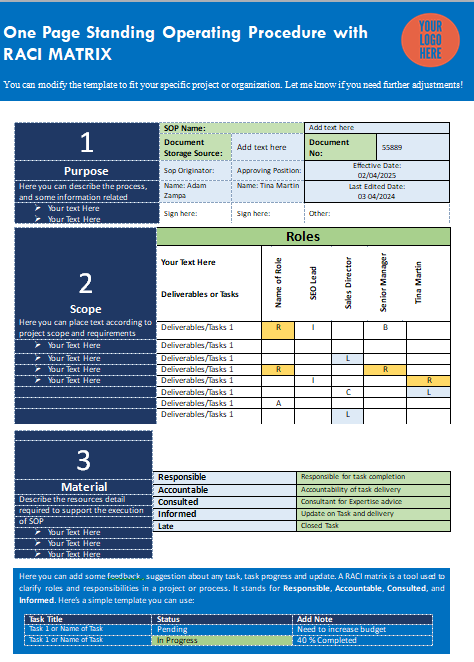
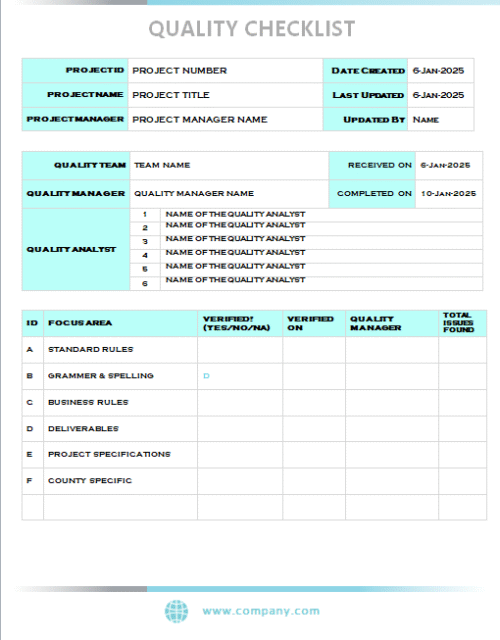
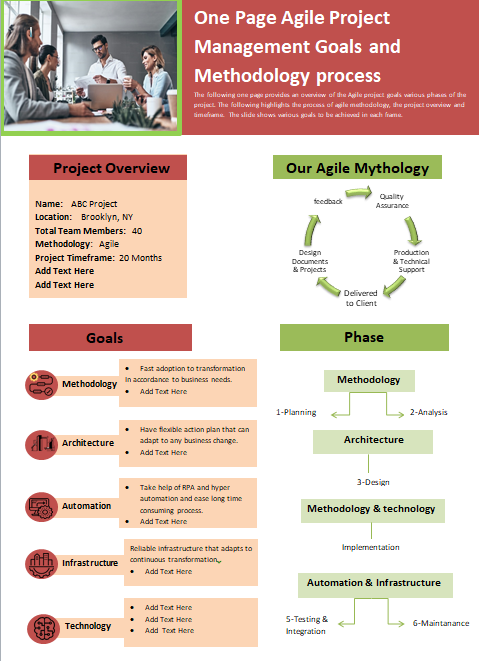
Following excel sheet represent different tasks with different categories starting and finish date, resource person Name and duration of given task, using different colors for highlighting the task for example timeline and starting view highlight as yellow, achievements and performance. while project performance is expressed in percentage ratio. given chart allow project members to assign the task on time.
Key Components of Simple Gantt Chart:
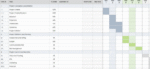
- Task List: A vertical line on left side of bar chart involves all tasks, milestones and activities of related projects. For example
Task Name: 1 Requirement Gathering
2 Draft Business Requirements
3 Sign off Business requirements
- Timeline: This is Top of the bar chart, a horizontal line shows the task duration with days/weeks/months, start date and date.
- Bars: These are horizontal lines in which task completion date given with progress percentage. for example start point means Task start Date
Finish point means Task complete Date. These horizontal bars are described in different colors and codes.
- Milestones: These are marks or indicators on a chart which represents the completion of given task.
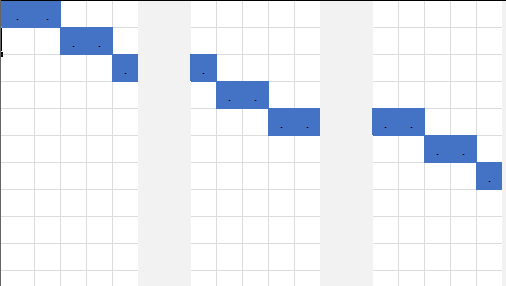
- Program Indicators: Color coded lines or visual bars in a project, responsible for the actual performance of project vs. expected project performance.
Gantt Chart Template Examples with Google Sheets:
Basic Gantt Chart Excel Template:
A basic Gantt chart is a visual tool of project management in which bars, timelines and milestones are expressed in horizonal and vertical column. List of given tasks usually represent by vertically lines and task completion expressed in horizontal lines with different colors combination including starting date of task and last date of task. we can modify as per need, like weekly/Monthly Gantt charts are design to show key performance of multiple projects. you may get free Gantt chart template from www.myplanningtemplates.com
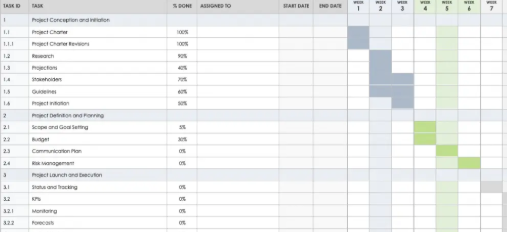
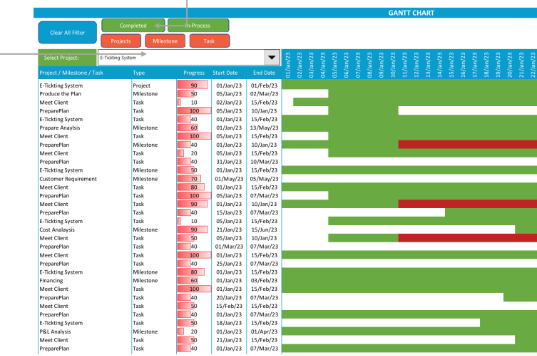
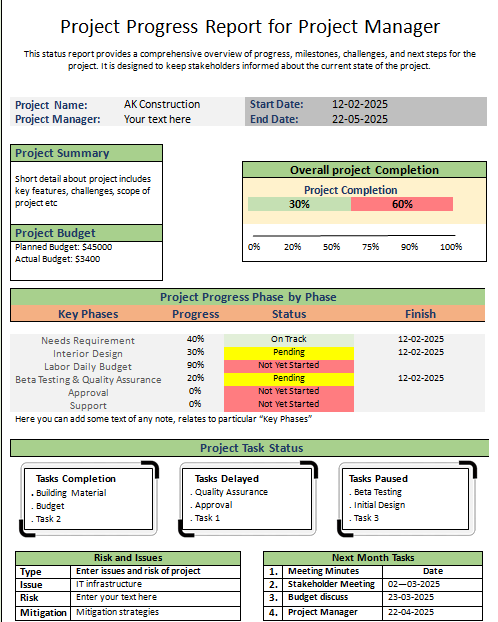
project Management Gantt Chart:
Project management Gantt chart design for mangers or stakeholders to represent timeline scheduling, task completion in graphically design or format
Project reporting Gantt chart:
Editable/customized spread google sheet specially designed to track project progress, highlighting the milestones, useful for managers and other team members of a project. GANTT Charts portfolio dashboards used to visualized project timeline and track the progress of any project timeline.
How to Create Simple Gantt chart template excel:
Firstly, before designing the simple Gantt chart. Fill all the data or desired information related to project with horizontal color bar in which starting date, task completion date, duration of task and project name shown. while the vertically line represent the projects name. we can use google sheets or excel to organize our data or visualized our project progress. RACII MATRIX EXCEL TEMPLATE is also efficient tool of project management which is used to enhance clarity.
Create a table in excel vertically and horizontal direction then put all your data in the sheet. these charts give you overview that how task are distributed over time and you can easily identify milestones and track deadlines easily. These Gantt charts are useful to monetarized, communicate project status compare project growth with other projects. Agile Gantt charts combines the visual timeline of traditional Gantt charts providing high level overview of project.
Benefits of Simple Gantt Chart Template Excel:
Mostly Sheets Gantt charts Templates are used to breakdown big and complex project of different sizes and shapes into small and easier task to estimate timelines quickly, manageable data and resources. they provide clear and visual vison for stakeholders and members. they provide comprehensive overview of project and minor issues related to given projects so errors, critical activities issues can be resolved on time to avoid delays. Gantt charts contribute to rise team productivity, increase communication skills and streamline the project planning. Gant charts are used is a project management tool used to plan and tracking of any project so wecan used it in different management fields.
References:
Follow the link to see detail and Example of a Gantt Chart
Reviews
There are no reviews yet.